
The conflict in the Middle East was bound to impact the European economy. Economists had predicted this. However, reality turned out to be even worse. GDP declined over the quarter, and annual growth significantly decelerated.

Gross domestic product, the key measure of economic development, for the entire European Union experienced a 0.1% decrease when comparing the first quarter of 2026 to the fourth quarter of 2025. Year-on-year, there is an increase in the indicator, but significantly less than indicated by earlier reports. GDP grew by 0.7% annually (half as fast compared to the analogous report from three months prior).
Further continuation of the article below the video Poland is ceasing to be an export economy. “This is good news”
The Eurozone recorded a larger quarterly decline and a stronger slowdown in annual growth. For countries using the common currency, GDP dynamics were -0.2% and 0.3% respectively. These are results significantly worse than economists’ forecasts, who had expected a quarterly growth of 0.1% and 0.8% annually.
Polish GDP Against the European Backdrop. A Very Good Annual Result
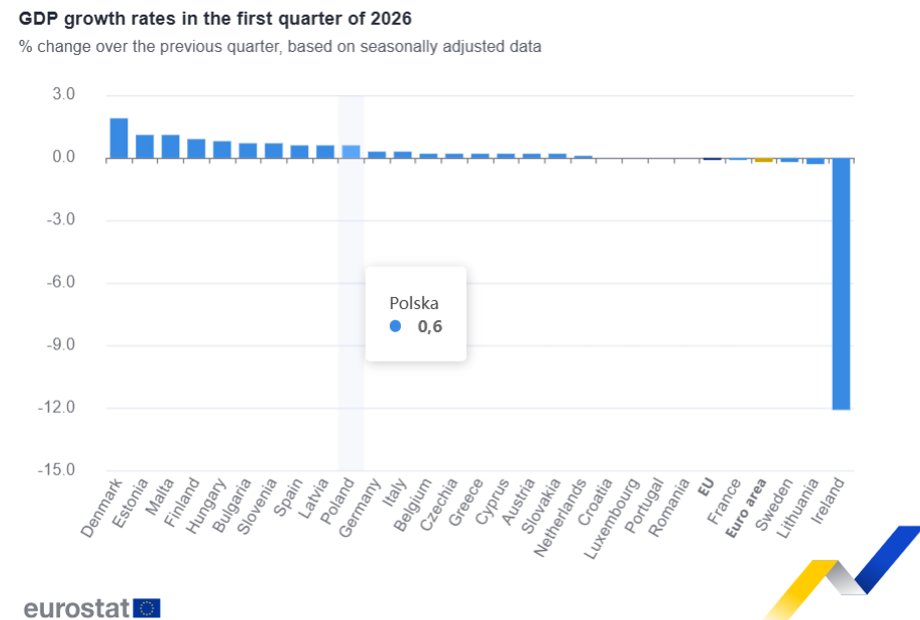
How does Poland fare against other European countries? From a quarterly dynamics perspective, our economy is closer to the best-performing countries than the worst, but it doesn’t stand out from the crowd. GDP grew by 0.6%. Latvia and Spain achieved the same result. Malta, Estonia, and Denmark grew faster, for instance. The latter country has the best quarterly result — there, growth was 1.9%.
Ireland’s economy shrank the most quarter-on-quarter (by 12.1%). Sharp fluctuations and declines in Irish GDP are mainly due to the presence of global technology and pharmaceutical corporations that have their headquarters there. This causes traditional GDP to not reflect the actual state of the local economy, and massive international transfers artificially inflate or deflate the statistics.
France, Sweden, and Lithuania also recorded negative GDP dynamics, but in their cases, the declines do not exceed 0.3%.
When comparing the first quarter of 2026 to the first quarter of 2025, Ireland also fares the worst (-16.8%). Romania is also below zero (-1.1%). Poland can boast growth of 3.5%. This is one of the better results. Only two countries developed faster: Denmark (5.9%) and Malta (4.3%).
For comparison, in the Czech Republic, annual growth was 2.2%, and in Germany, it was a mere 0.3%. Europe’s second-largest economy, France, recorded GDP growth of 0.9%.
GDP in Europe. What Makes Up the Indicator?
Eurostat indicates the contribution of key components of the indicator to GDP in Europe. On a quarterly basis, household consumption expenditure, as well as government expenditure separately, were positive in both the Eurozone and the EU (each +0.1 percentage points).
Gross fixed capital formation was negative in both the Eurozone and the EU (each -0.1 percentage points). The same applied to changes in inventories.
Exports minus imports, on the other hand, were negative in both the Eurozone (-0.3 percentage points) and the EU (-0.2 percentage points).
Thank you for reading our article to the end. Stay up to date! Follow us on Google.